
Reports are a clean and professional way to present data. All audio files, video clips, charts and word clouds from any of your Phonic surveys can be added to a report and shared with a link in seconds!
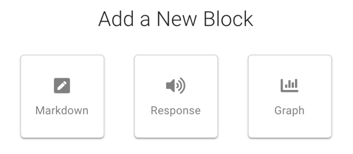
To create a report, navigate to “Reports” in the left side-bar menu, and then click the “+ New Report” tile. You can currently add 3 types of data to a report.
- Markdown. Add your own notes.
- Responses. Add any survey response. Audio and video responses will be playable within the report.
- Data Visualizations. Add data visualizations from any of your surveys.
To add these elements, navigate to the “Add Survey Data” button in the bottom left corner of your report.
From here, you can add your data of interest:
Adding Notes Using Markdown
You can change font properties by using Markdown.
Use # at the beginning of your text to create headings, as typed below. Note that the number of # indicates the heading style (e.g., Heading 1, Heading 2, Heading 3, etc.)
# This will appear as Heading Style 1.
## This will appear as Heading Style 2.
### This will appear as Heading Style 3.
_This will appear italicized_
* Use two asterisks on either side of your text to bold it.*
For a full guide of what you can do in Markdown click here.
Markdown also supports some HTML. Font style and colour can be changed using HTML. See some examples below.
<p style="font-family: Arial">This will appear as Arial font text</p>

<p style="color: red;">This will appear as red text</p>

<font face="Comic Sans MS" size="80px" color="red">This will appear as Comic Sans MS font in red.</font>
Adding Responses In Reports
Any response type collected in Phonic can be added to a Report, and audio/video responses are playable within reports.
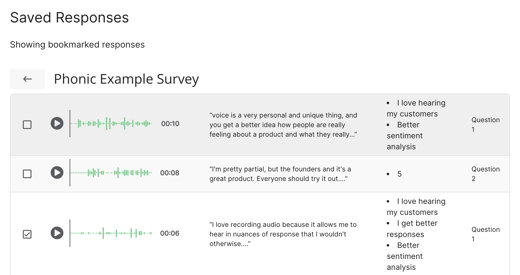
Step 1: Bookmark Responses
A response must be bookmarked in the Results dashboard in order to be added to a report. To bookmark a response, open the survey and go to Questions view. Here you will see all of the responses to your questions. On the left hand side of each response there is a bookmark icon. Click the icon so that the bookmark changes from white to grey.
Now that this response has been bookmarked, it can be added in Reports. Only bookmarked responses will appear in Reports.
Step 2: Adding Responses to a Report
To add a response to a report, click the “Add Survey Data” button in the bottom left of the Report, then select “Response”. All surveys with bookmarked responses will appear here.
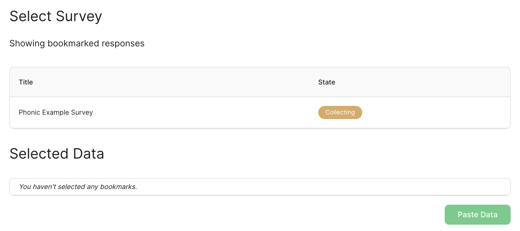
When you click on the survey of interest, all of the bookmarked responses for that survey will appear.
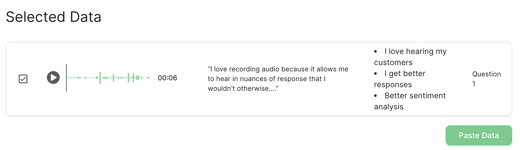
Select the data that you want to add to your report. Then, click “Paste Data”.
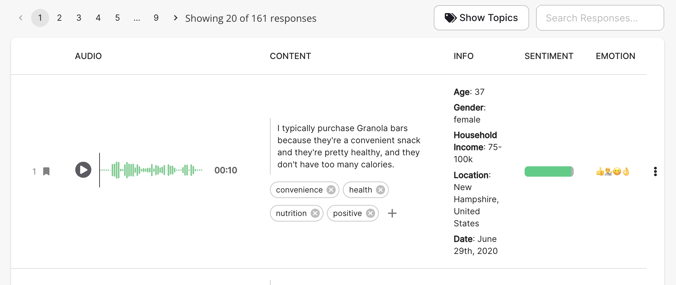
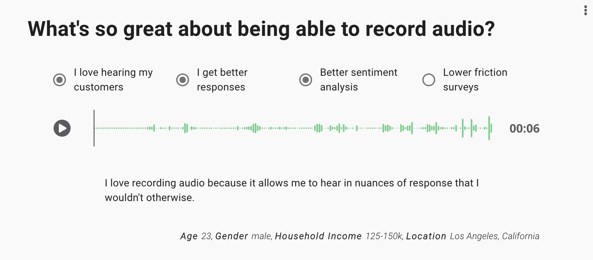
The response data will now appear in the Report as shown below. The example below is an Audio + Selection response type. Here we can see which options the respondent chose, and their audio response explaining their choices. This survey also collected demographic information, which is displayed in the bottom right corner of the response.
Note that in order for audio data to be visible to anyone with the report link, it must be made public. This can be done by clicking "Make Public" in the top right corner. To delete any response from a report, click on the three dots in the top right corner and click "Delete Block".
Another Way to Add Responses
Responses can also be added to a report directly in the Results dashboard. Navigate to Question view for the survey you would like to incorporate into your report, and click on the question of interest. Click on the three dots to the far right of the response, and then click "Add to Report".
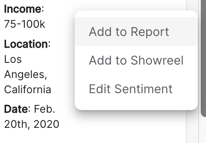
A pop-up window will appear, where you can select the report that you would like to add the response to.
Adding Data Visualizations
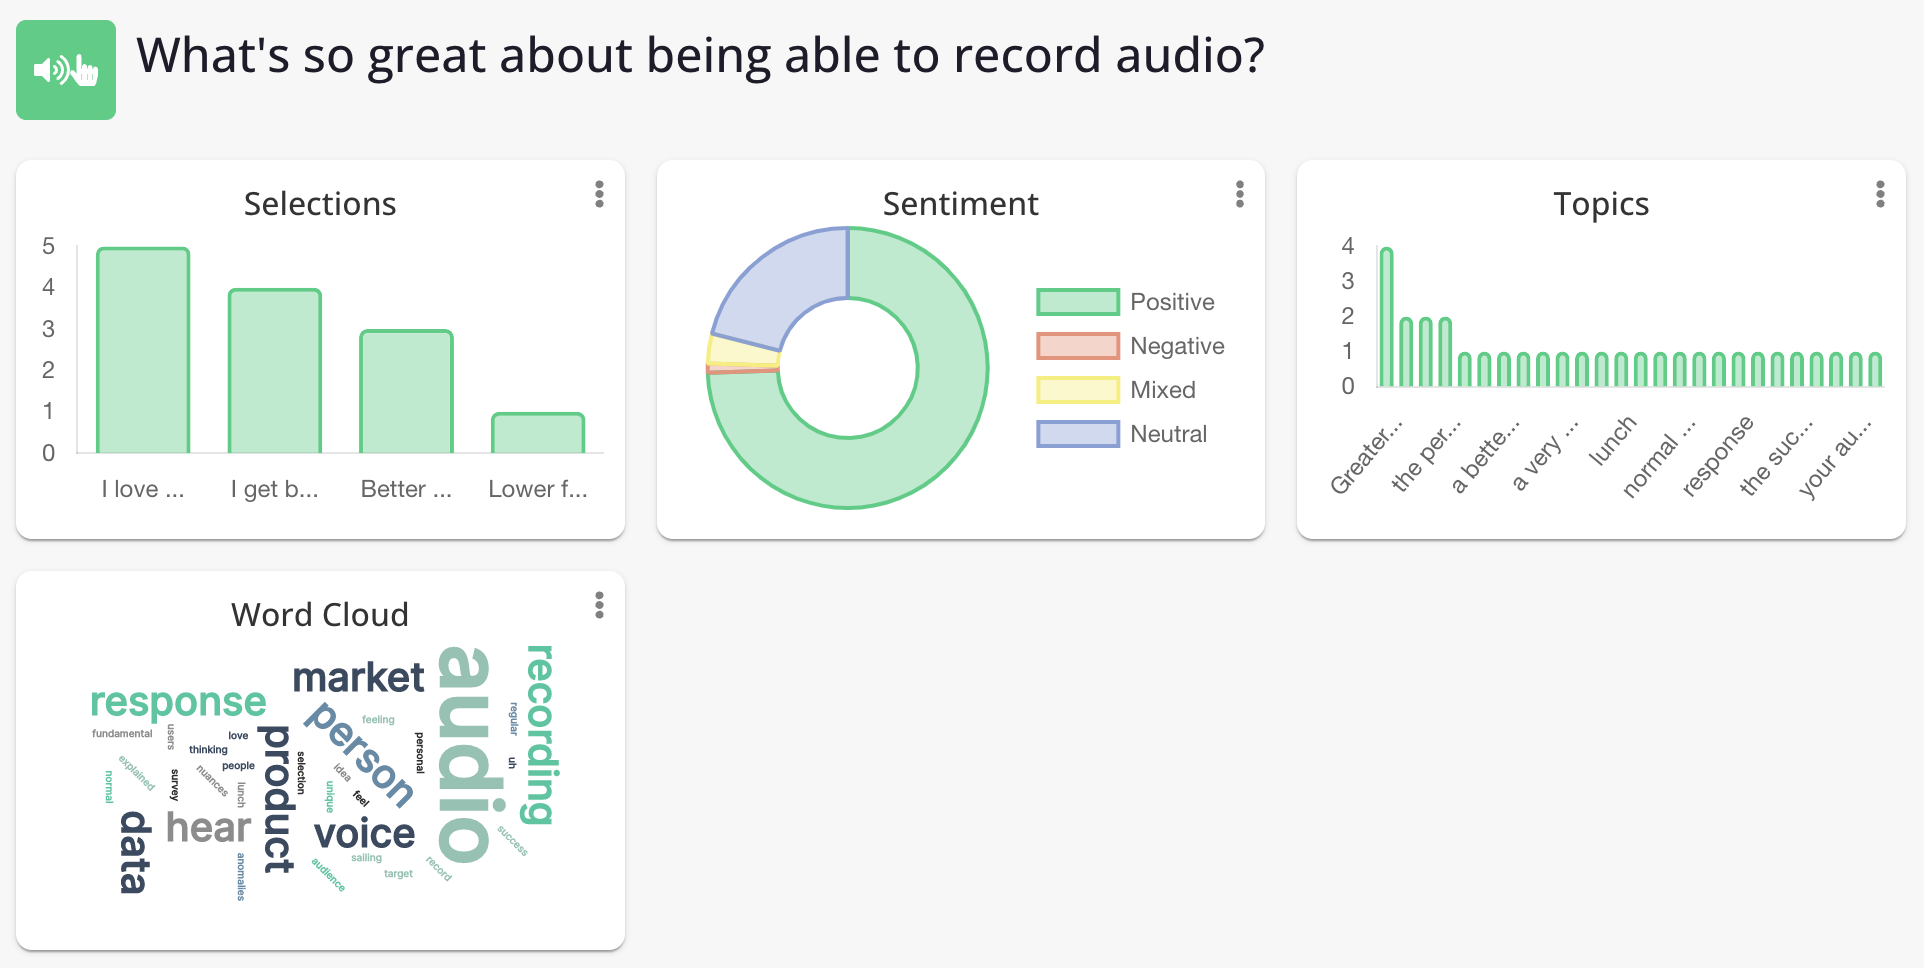
To add data visualizations to a report, open your survey in Question view. Click on the question that you want to add a graph for. Here, you will find all of the data visualization solutions that Phonic automatically generates for that specific question! This includes response frequencies (for multiple choice questions, sliders, dropdowns, etc.) and word clouds (for audio response questions). To add a data visualization to a report, click the three dots in the top right corner of the visualization, and then select the report that you want it to be added to.
Editing and Sharing Your Report
Editing a report is flexible, such that elements can always be added and reports can be re-organized. To re-organize a report, click on a block and drag it to the desired location.
Reports are shared through a link. Anyone who has this link can view the report but cannot make any changes. This link will reflect any saved changes, so there is no need to re-share the link, or send a new link! Note that Reports are dynamic documents. You can print the webpage as a PDF, however, once downloaded as a PDF you will be unable to listen to any audio or video responses.