Phonic provides data visualization solutions at the survey level and at the question level.
Survey Breakdown
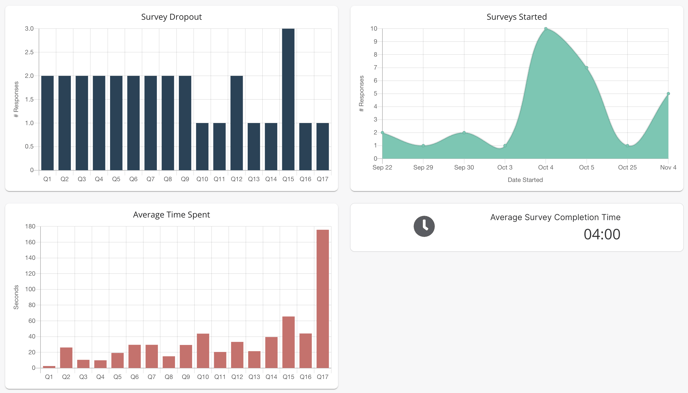
Survey completion information is available in the Completion tab. Here you will see visualizations for dropout, surveys started, average time spent in total, average time spent on each question, and a break down of device type used. Dropout data is useful in determining if respondents are stopping at a specific question they find confusing, and gives the survey designer an opportunity increase completion rates by improving problematic questions.
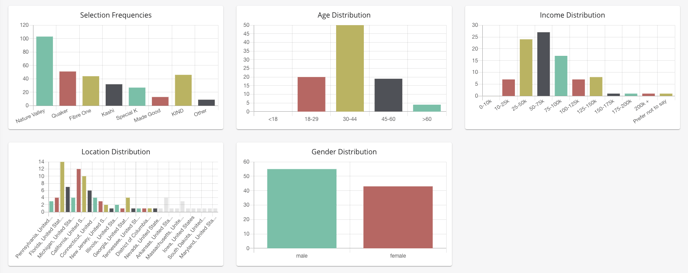
Demographic Breakdown
Visualizations of responses for various demographics are available for each survey question in question view under the Analysis tab.
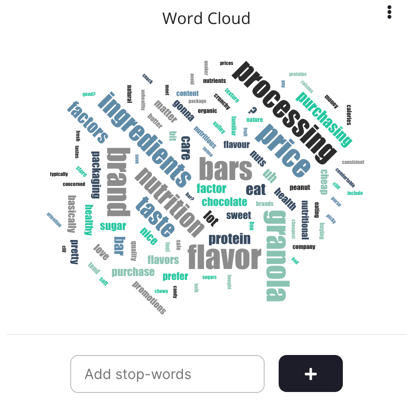
Audio & Video Questions
Audio and video question types will also have visualizations for sentiment, emotion, topics and word clouds. Word clouds can be easily edited by adding "stop-words". Stop-words will be removed from the word cloud.